Screenshots |
||
|
On this page you can find some animated screenshots taken from
the applications I developed, which can be considered unusual for
PowerBuilder applications. They demonstrate the possiblity of creation
of rich graphical user interfaces with PowerBuilder that really appeal
to users. |
||
|
The following two screenshots are taken from
the demo application presenting the techniques described in my article
"Highlighting Selected Text in a DataWindow",
PowerTimes vol. 10/issue 1 (March-April, 2003), p 10-12.
You can find the article in the
Downloads section. |

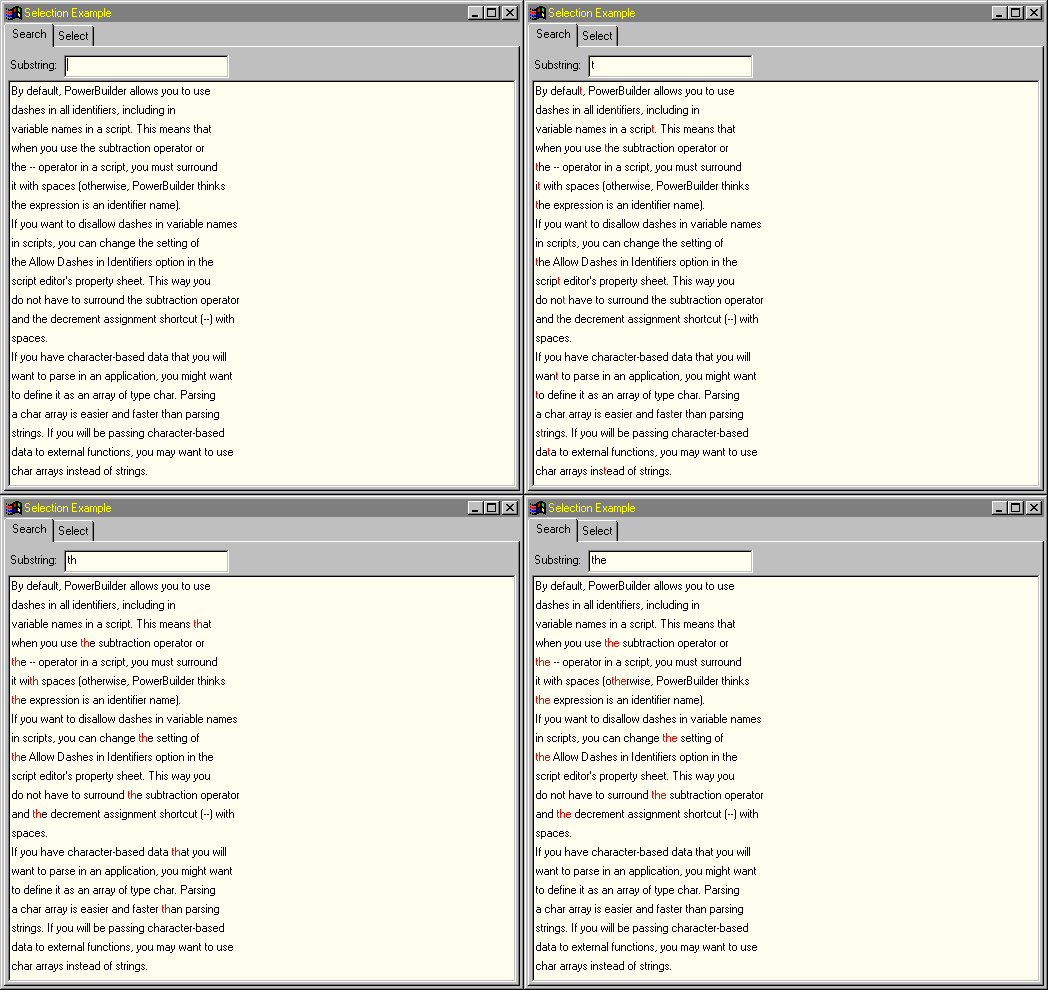
| This one demonstrates a single selection of the first occurence of a substring in a row. The user enters the first letter of the substring and the first occurences of this letter in all rows get immediately highlighted. Then the user enters the second letter of the substring and the first occurences of this substring get highlighted. The process continues till the substring is entered completely. |

|
This one demonstrates a multiple selection in one row. The user
specifies the start position of the selection and the length of the
selection, and clicks the "Select" button. It can be done
several times for each row so that the row can have several
highlighted parts. |
|
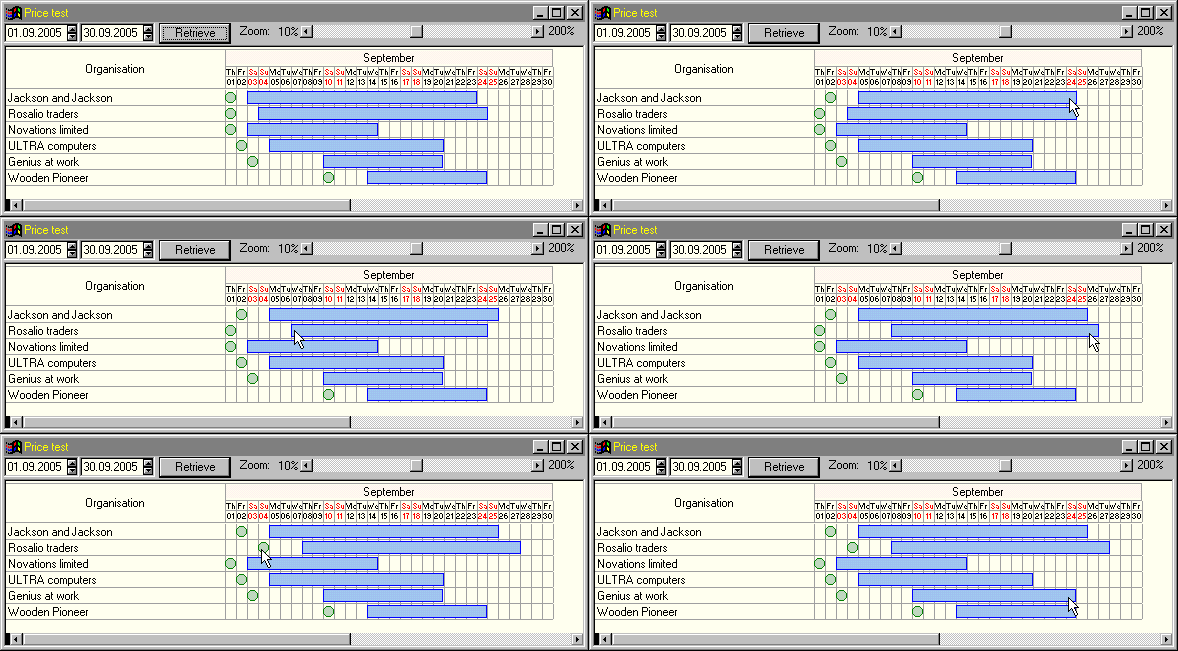
This screen visually displays the dates of gathering information
from companies (represented by green circles) and the periods of
validity of the information (represented by blue bars). Initial or
planned dates go to this screen as input data. Then the user can
correct the data (to set the actual date of getting the information
from the company or to change the period of its validity) using the
mouse. |
|
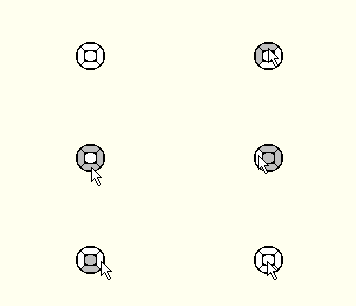
This screen allows the user to point what part of the tooth is damaged.
The tooth is schematically divided into several parts in the standard
way. The user simply clicks any part to mark it as damaged or to
unmark it. |
|
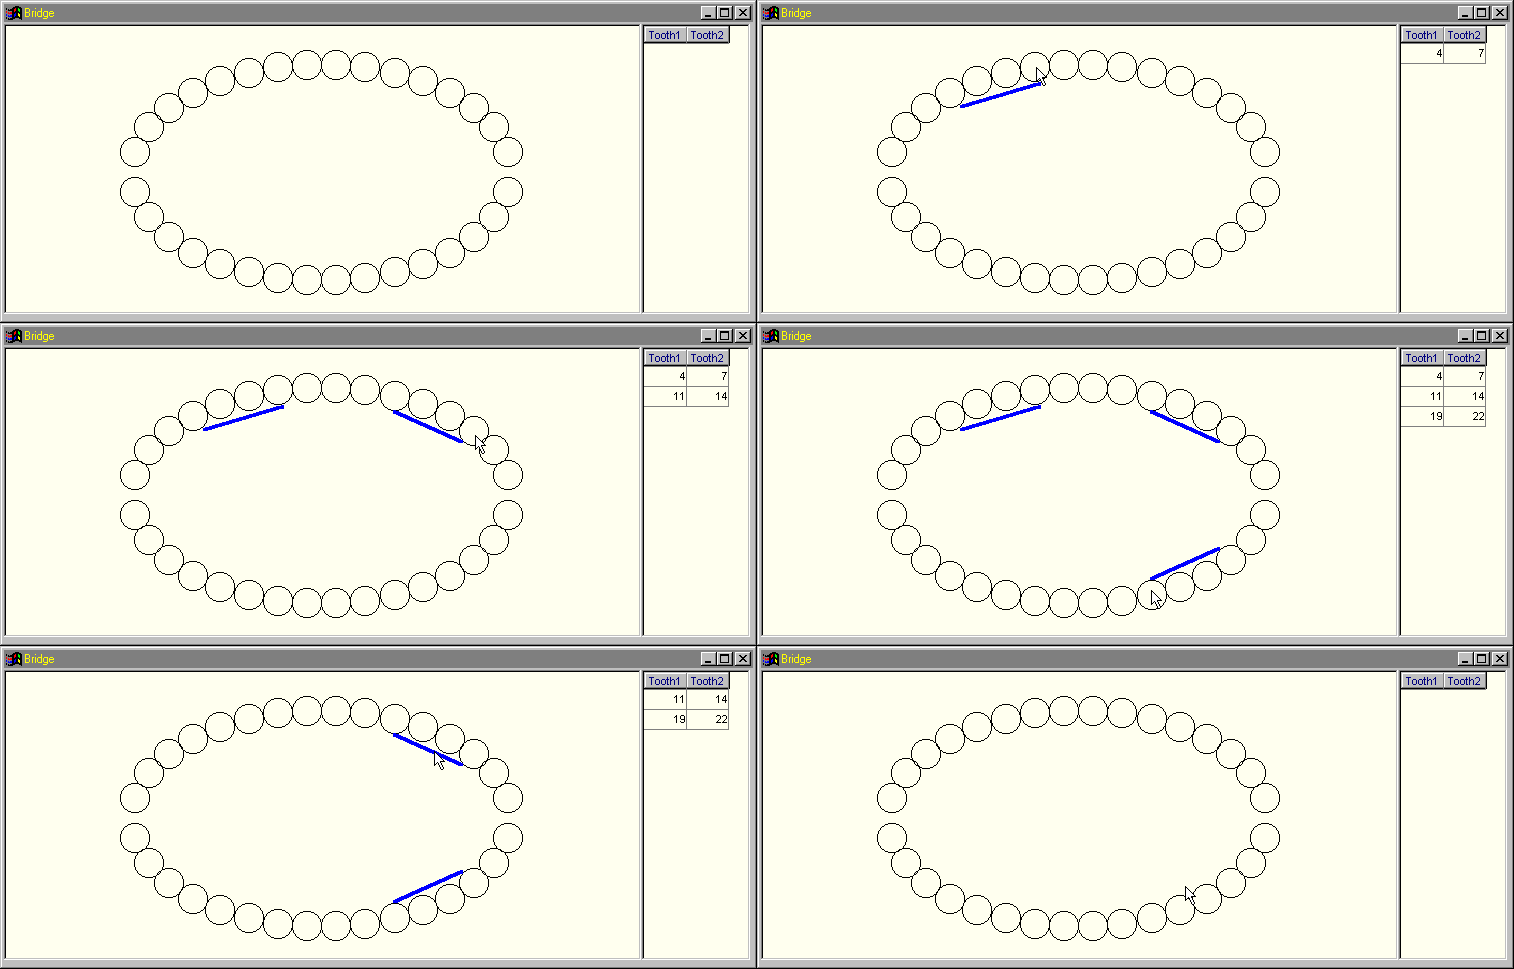
This screen allows the user to draw schematically where the dental
bridge is placed (from which to which tooth). Teeth are represented
by circles and the bridge is represented by a line. The user clicks
the first tooth which the bridge is attached to and then the second
one. To remove the line, the user simply clicks it. The right part
of the screen displays the entered data in the table form. |
|
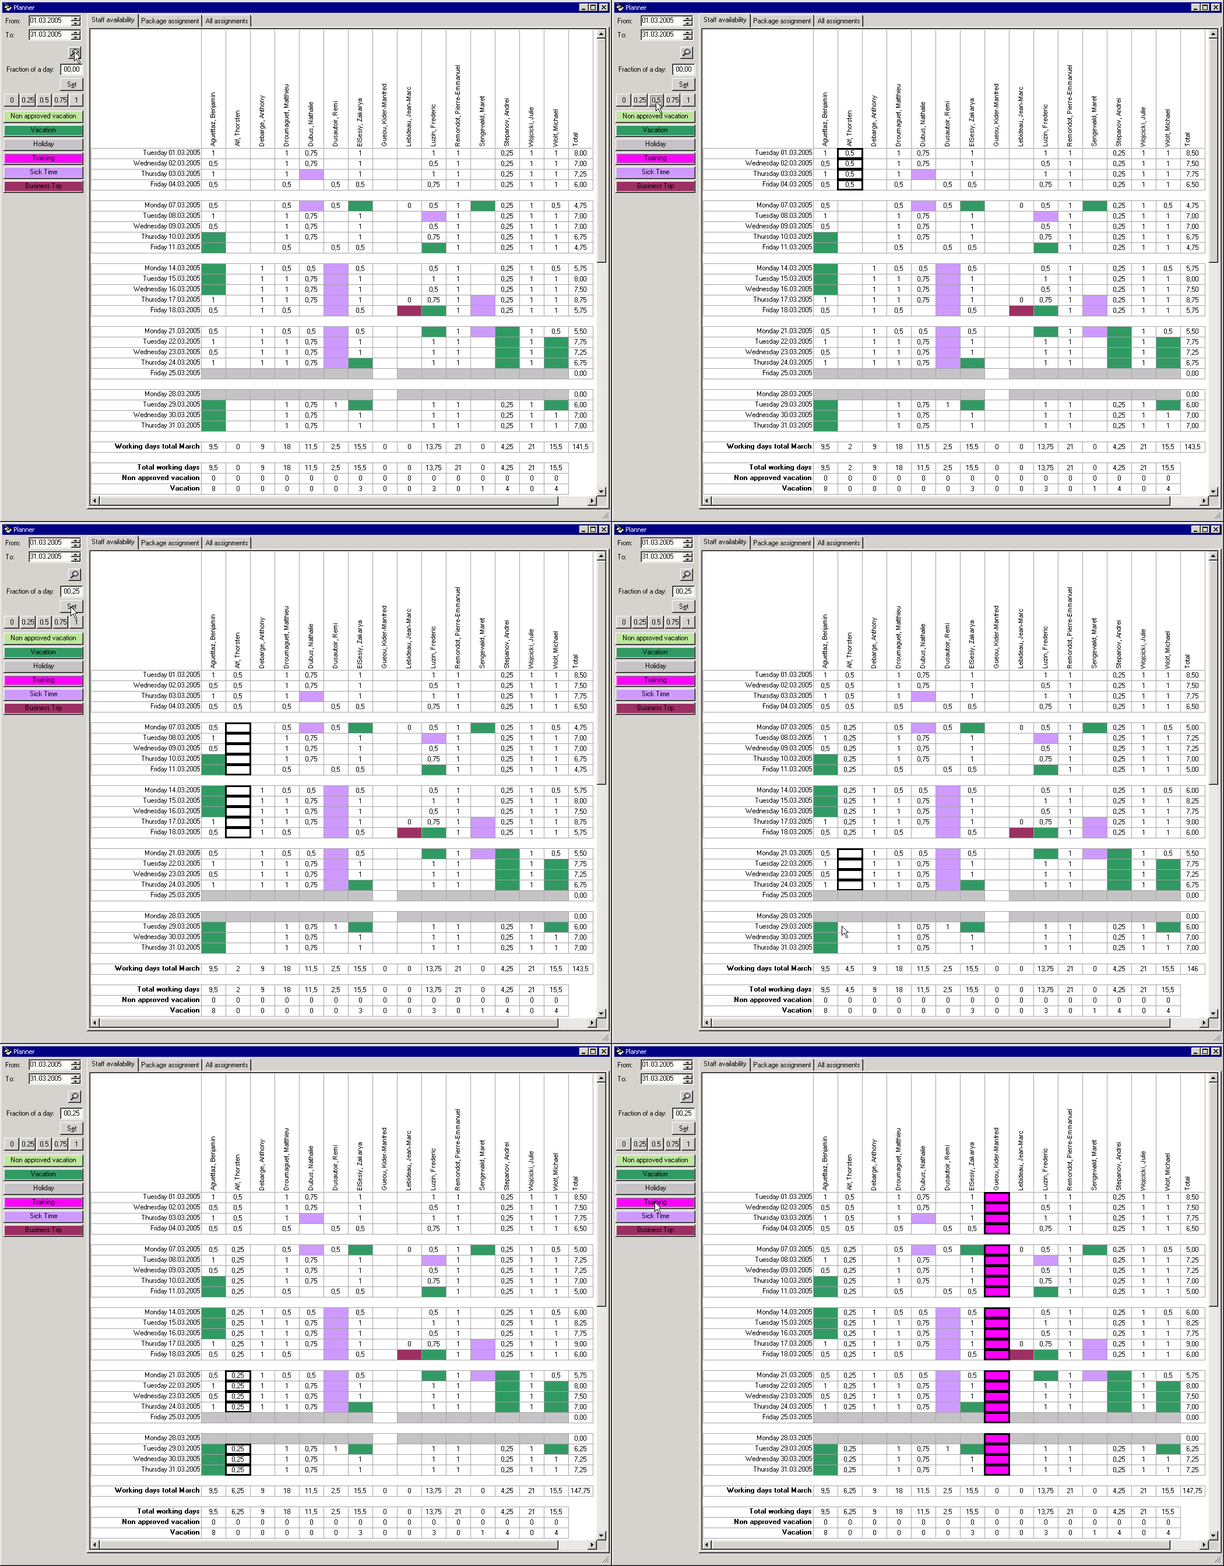
This screen presents the developers time planner. It allows the user
to enter what part of a working day every member of the team will
spend on development. The user selects particular cells using the
mouse (multiselection with the Control and Shift keys is possible)
and then enters the fraction of the day. It can be done in several
ways: It is also possible to mark the person as unavailable for work using the buttons with predefined reasons, such as "Sick Time" or "Training". |
|
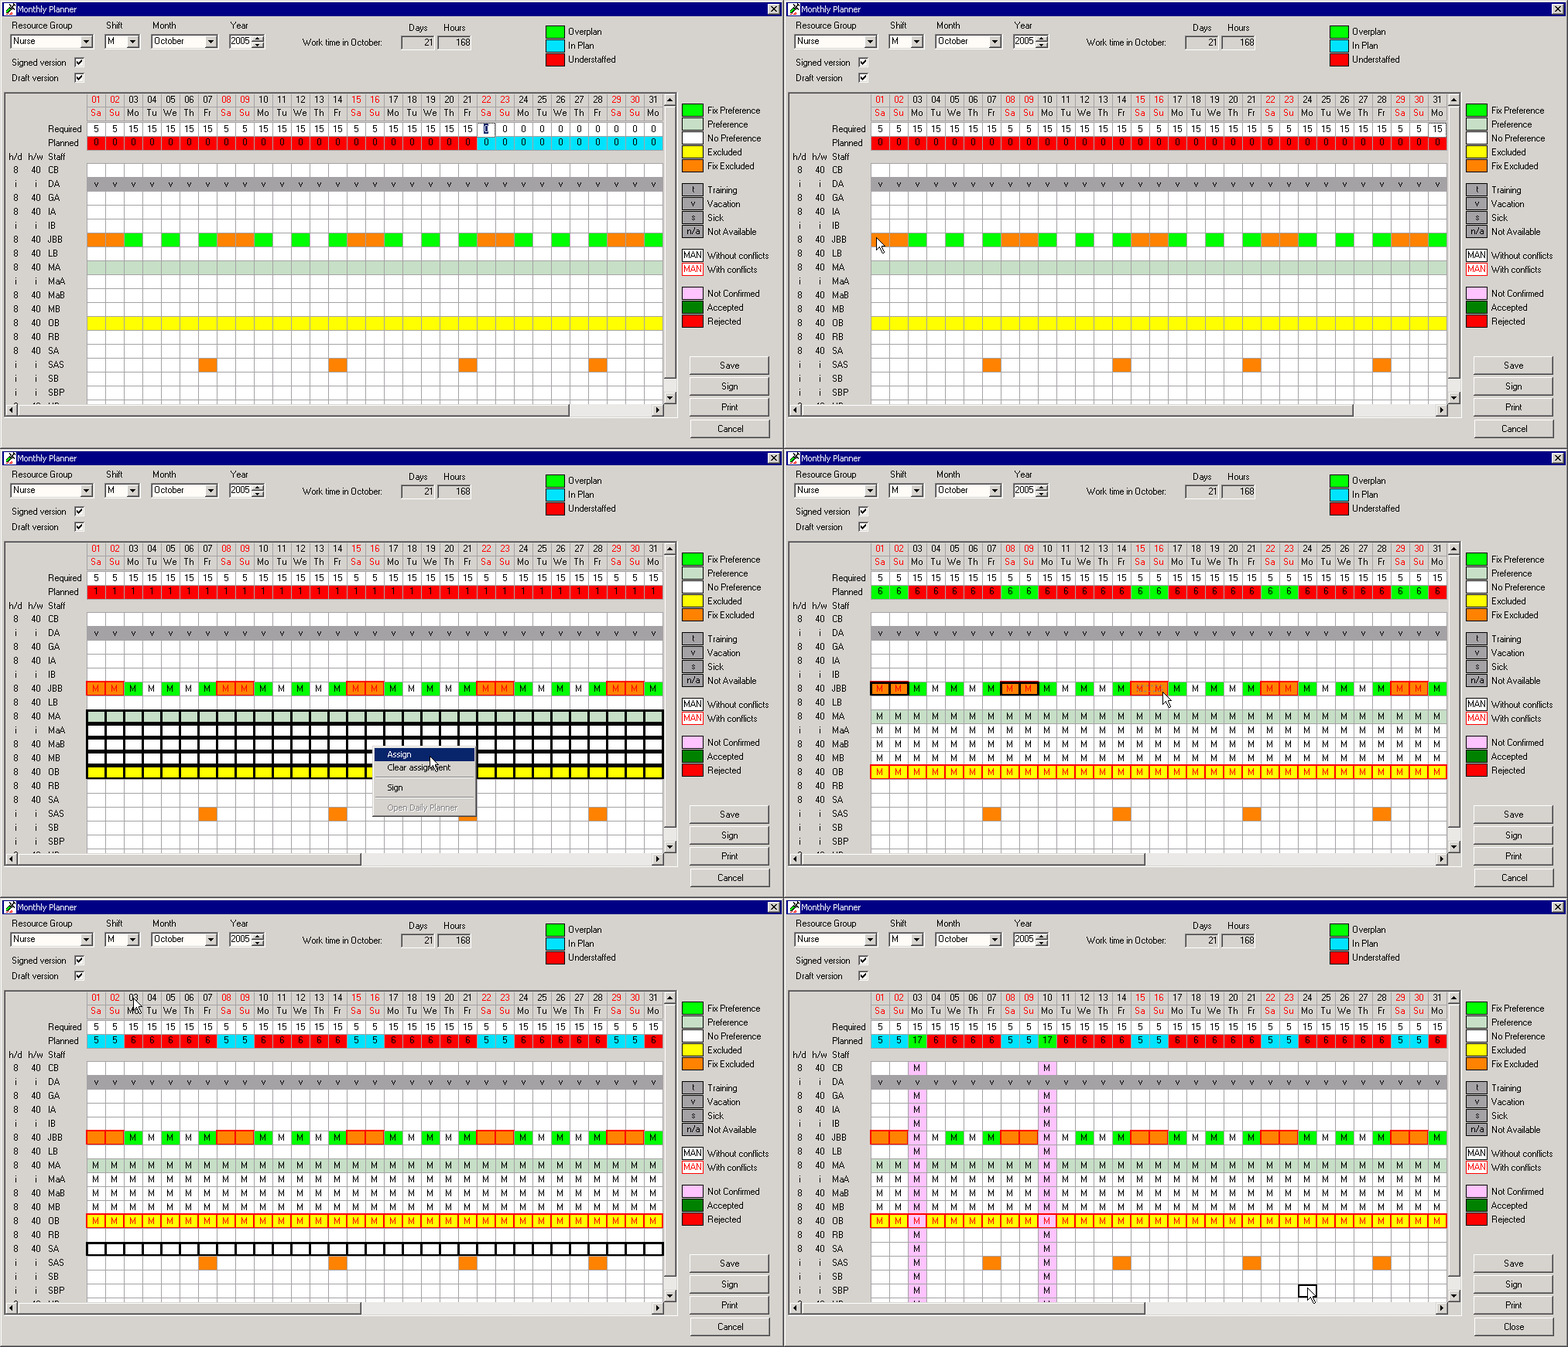
This is another planner: Monthly Shift Planner. It allows the user
to plan shift assignments for each member of the staff group on the
monthly basis. The user enters the required number of staff for the
selected shift and then assigns staff. To do that, the user selects
particular cells using the mouse (multiselection with the Control
and Shift keys is possible) and calls the "Assign" function
via the popup menu. Each staff member may have working time preferences of different strength. The kind of the preference is marked by the cell colour. If the assignment conflicts with the preference, the assignment letter is displayed in red. In addition, a staff member may have off-time periods when he or she cannot be assigned. The number of assigned staff is calculated and displayed in the "Planned" row. The colour of cells in this row is based on comparison between required and planned numbers. After all desired shift assignments are done, the user signs them on the individual basis. The user selects the assignments to be signed and calls the "Sign" function via the popup menu. The cells with signed assignments are also marked by the colour. |
|
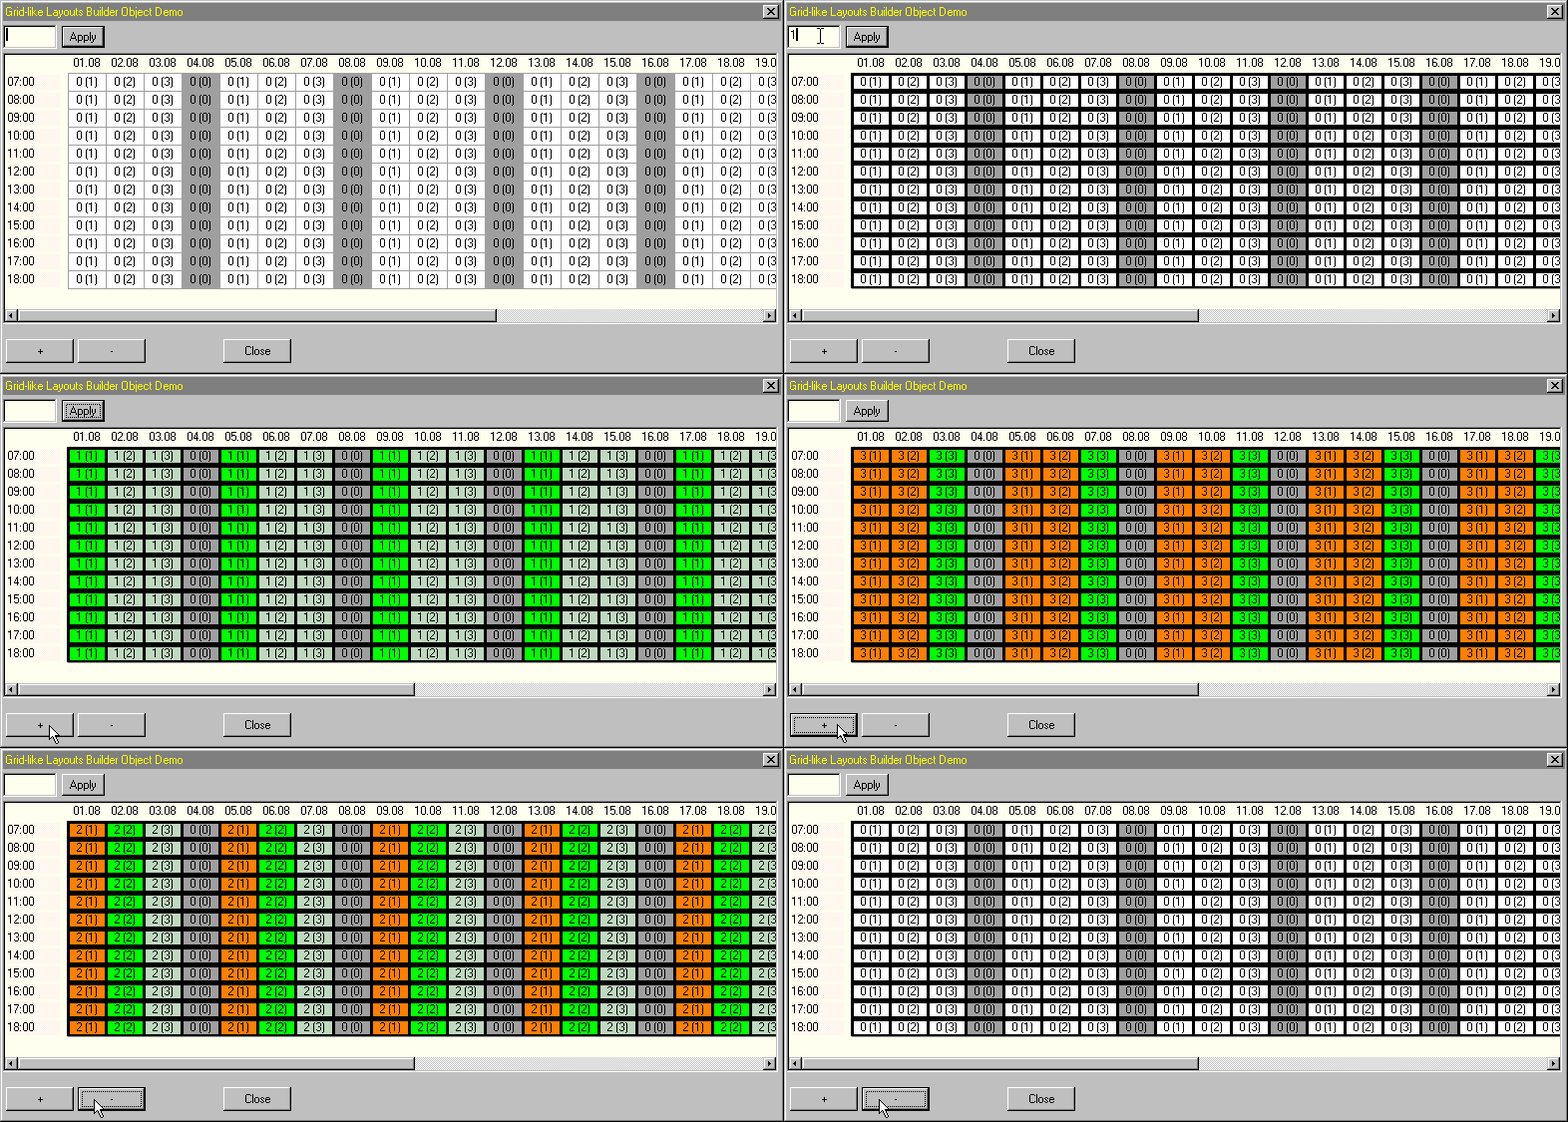
This screenshot is taken from the demo application that presents the
techniques used for creation of the above planners. The numbers in
the brackets are planned values, and the numbers before the brackets
are actual values. You may enter the planned value in the field and
click the "Apply" button. You may increase and decrease
the actual values in the selected cells using the "+" and
"-" buttons. The colour of the cells is changed basing
on the comparison between the planned and the actual values. The compiled application is available for download in the Downloads section. |
| To be continued... | Home |